Wealth Wise
Growth Advice
Get a Callback
If you have any query fill in the form below and we will call you back within the same working day.
I agree to be contacted by your team on the given mobile number.

Portfolio Management Services

Portfolio Management Services (PMS) is a sophisticated investment vehicle that offers a range of specialized investment strategies to capitalize on opportunities in the market. SMC Private Wealth offers PMS as an investment vehicle for select investors with an option to personalize and customize portfolios through investment mandates. We also offer equity Portfolios which look to generate capital appreciation by investing in a diversified portfolio of equity or equity-related securities. These portfolios are structured to suit different risk profiles of customers.

SMC Growth PMS

Investment Objective

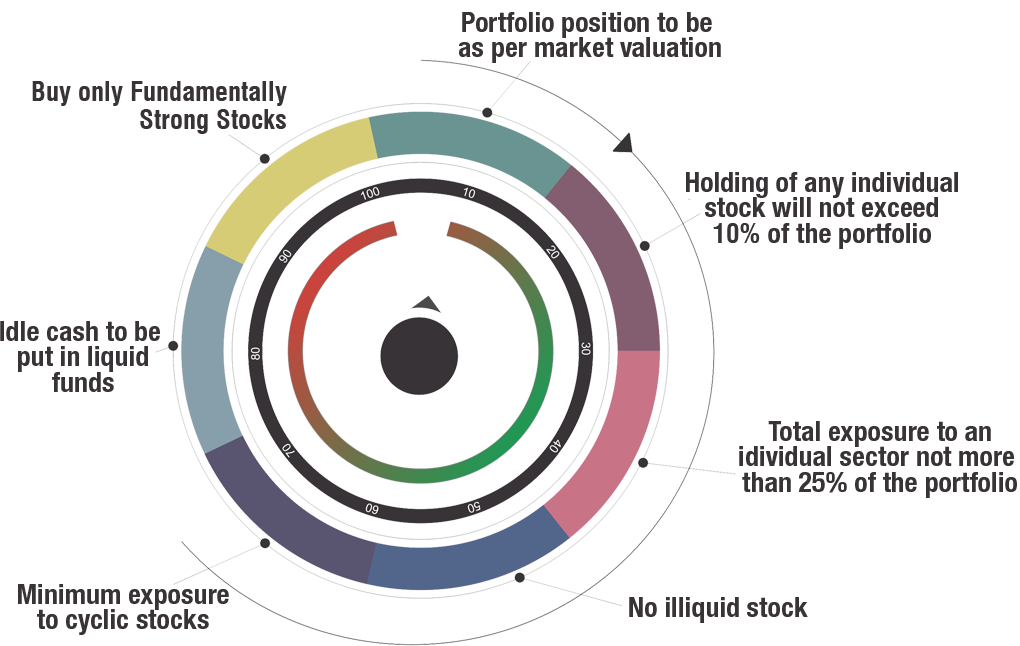
Buying fundamentally sustainable growing businesses and outperform the benchmark indices by investing in equity and equity-related instruments including mutual funds.

Investment Philosophy

  • Strong Track Record in Terms of top & Bottom line
  • Efficient Capital Allocation
  • Sustainable ROEs/ROCEs
  • Debt Profile & Cash FLow Generation
  • Ethical Management Practices
  • Shareholder Friendly Decisions
  • Evaluating Promoter's Track Record
  • Accounting Red Flags
  • Industry Prospects
  • Size of Opportunity
  • Sustainability of the future Earnings
  • Management's Long-Term Outlook
  • Historical Valuation of the Company
  • Valuation analysis of the industry
  • Estimation of the Fair Value
  • Re-Rating of the Multiples

Robust Fundamentals

  • Strong Track Record in Terms of top & Bottom line
  • Efficient Capital Allocation
  • Sustainable ROEs/ROCEs
  • Debt Profile & Cash FLow Generation

Exemplary Corporate Governance

  • Ethical Management Practices
  • Shareholder Friendly Decisions
  • Evaluating Promoter's Track Record
  • Accounting Red Flags

Bright Future Outlook

  • Industry Prospects
  • Size of Opportunity
  • Sustainability of the future Earnings
  • Management's Long-Term Outlook

Attractive Valuation

  • Historical Valuation of the Company
  • Valuation analysis of the industry
  • Estimation of the Fair Value
  • Re-Rating of the Multiples

Growth PMS Top 10 Holdings*

Scheme Security Portfolio Category Wtg
Reliance Industries Ltd Refineries 5
Techno Electric & Engineering Company Ltd Construction & Engineering 5
State Bank of India Banks 4.5
Syrma SGS Technology Ltd Industrial Machinery 4.5
Aptus Value Housing Finance India Ltd Finance 4
Deep Industries Limited Miscellaneous 4
Enviro Infra Engineers Ltd other 4
HDFC Bank Ltd Banks 4
Larsen & Toubro Ltd Civil Construction 4
Mahindra & Mahindra Ltd Automobiles 4

*Data as on 31st Oct. 2025

Performance Data**

Performance
(Return TWRR)
1 M (%) 1 Yr (%) 2 Yrs (%) 3 Yrs (%) 4 Yrs (%) 5 Yrs (%) SI
Growth (TWRR Unitised) 6.20 0.88 14.16 14.98 11.42 19.47 14.97
Customise Portfolio (TWRR Unitised) 5.44 -1.93 14.96 14.32 8.05 0.00 7.27
BSE 500 TRI 4.27 5.32 19.61 16.19 12.99 21.05 18.00
Moderate Equity (TWRR Unitised) 4.82 6.64 16.94 16.06 14.96 23.73 16.97
NIFTY 50 TRI 4.62 7.59 17.50 13.90 11.16 18.57 15.72

**Performance of strategy is calculated for live accounts on TWRR method as on 31st Oct 2025. *YTD: Calendar Year 2025 | Above 1 year returns are CAGR

Why SMC Growth Portfolio?***

  • 100% of the companies in the model portfolio are profit making and more than 80% are dividend paying companies
  • Weighted Average Return on Equity (ROE) TTM of the model portfolio is 15.86%
  • Weighted Average Return on Capital Employed (ROCE) TTM of the model portfolio is 20.34
  • More than 95% of the companies in the model portfolio have Debt-to-Equity ratio below 0.70
  • More than 80% of the companies in the model portfolio have interest coverage ratio above 3 times
  • More than 90% of the companies in the model portfolio holding have no promoter pledge
  • More than 80% of the companies in the model portfolio have promoter holding above 35%
  • More than 85% of the companies in the model portfolio have institutional holding above 10%
  • Weighted average model portfolio P/E of 29 is at a discount of 25% as compared to MF Flexicap Category Avg P/E of 38.95
  • Weighted average model portfolio P/E of 29 is at a discount of 40% as compared to MF Smallcap Category Avg P/E of 48.54
Efficiency
  • 100% of the companies in the model portfolio are profit making and more than 80% are dividend paying companies
  • Weighted Average Return on Equity (ROE) TTM of the model portfolio is 15.86%
  • Weighted Average Return on Capital Employed (ROCE) TTM of the model portfolio is 20.34
Solvency
  • More than 95% of the companies in the model portfolio have Debt-to-Equity ratio below 0.70
  • More than 80% of the companies in the model portfolio have interest coverage ratio above 3 times
  • More than 90% of the companies in the model portfolio holding have no promoter pledge

Shareholding
  • More than 80% of the companies in the model portfolio have promoter holding above 35%
  • More than 85% of the companies in the model portfolio have institutional holding above 10%
Valuation
  • Weighted average model portfolio P/E of 29 is at a discount of 25% as compared to MF Flexicap Category Avg P/E of 38.95
  • Weighted average model portfolio P/E of 29 is at a discount of 40% as compared to MF Smallcap Category Avg P/E of 48.54

Note: Figures as on 31st August, 2025. Please note that Banks and NBFCs have been excluded from the model portfolio analysis as they require separate calculations. The numbers are adjusted wherever necessary, to make them meaningful.

Risk Management

Direct On-Boarding

All clients have an option to invest in the products / investment approaches directly, without intermediation of persons engaged in distribution services.

Clients can directly approach us by sending an email on contactus@smcwealth.com